Visualizing Protein-Protein Interactions
Explore the tool or read the in-depth writeup.
As part of a weekend Hackathon, I built a tool to visualize the graph of a protein-protein interaction (PPI) network and investigated a few interactions of interest.
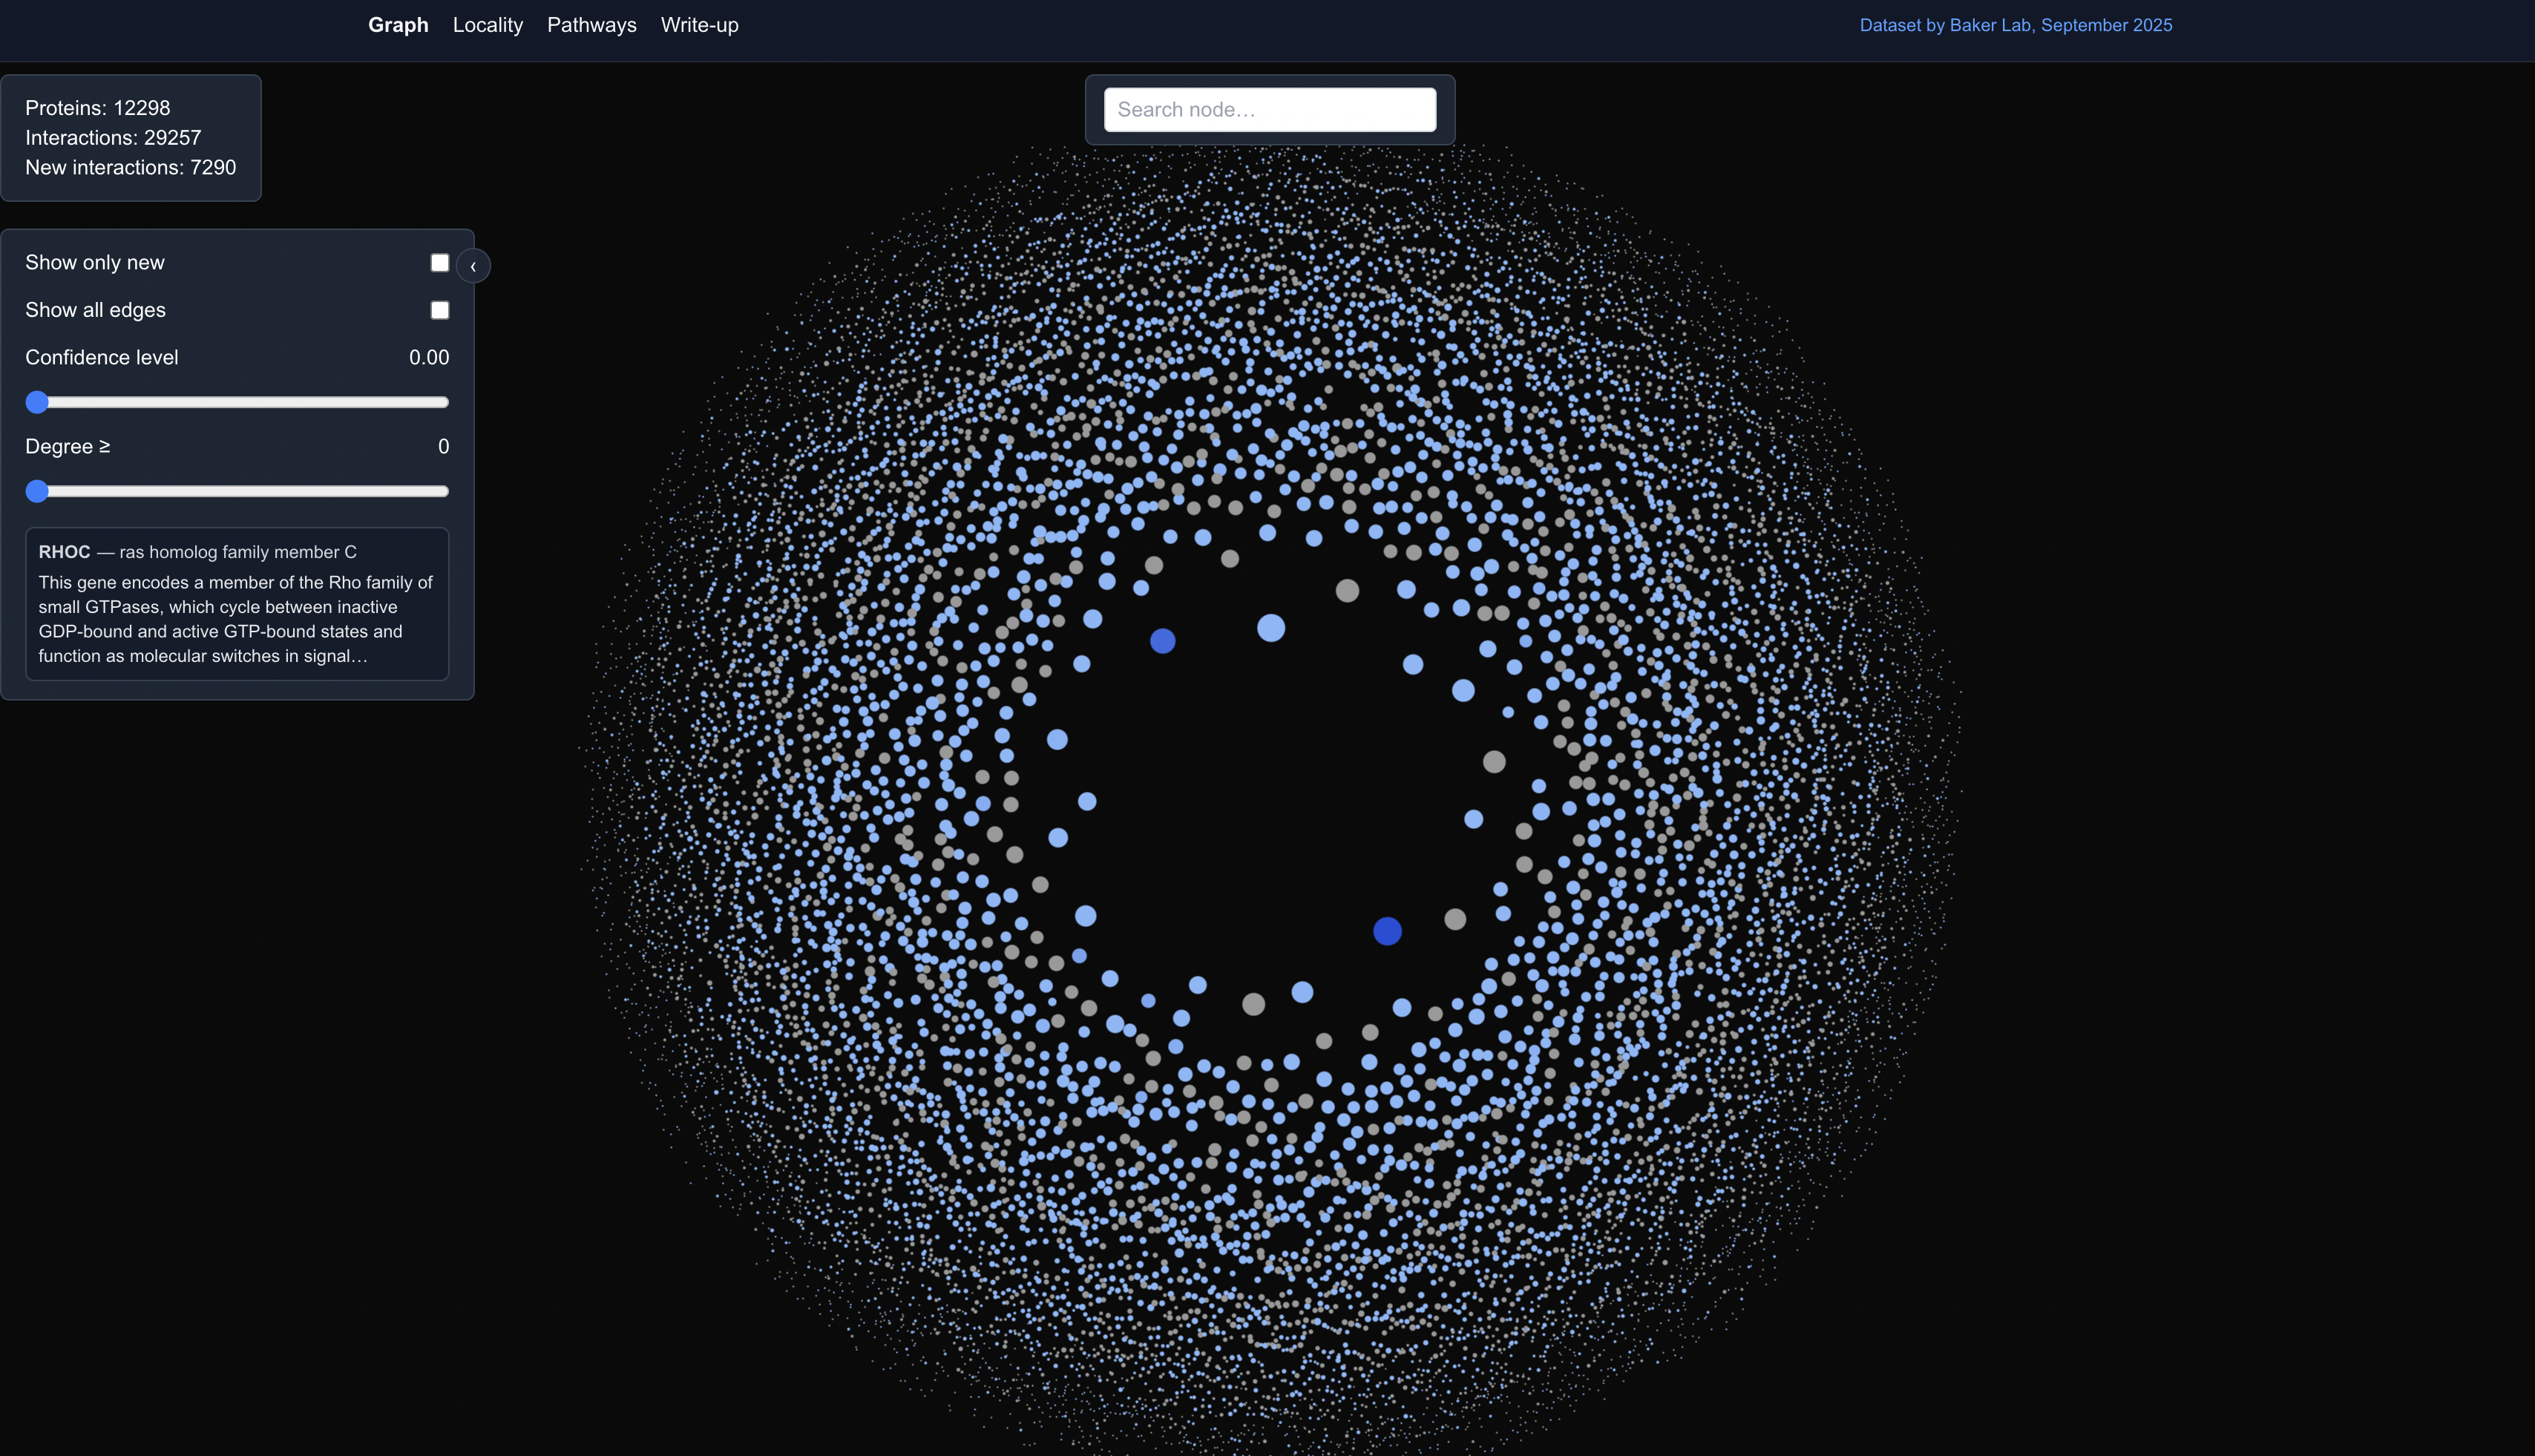
The dataset used in this visualization was not experimental, but instead was predictions by a computational pipeline (original paper here).
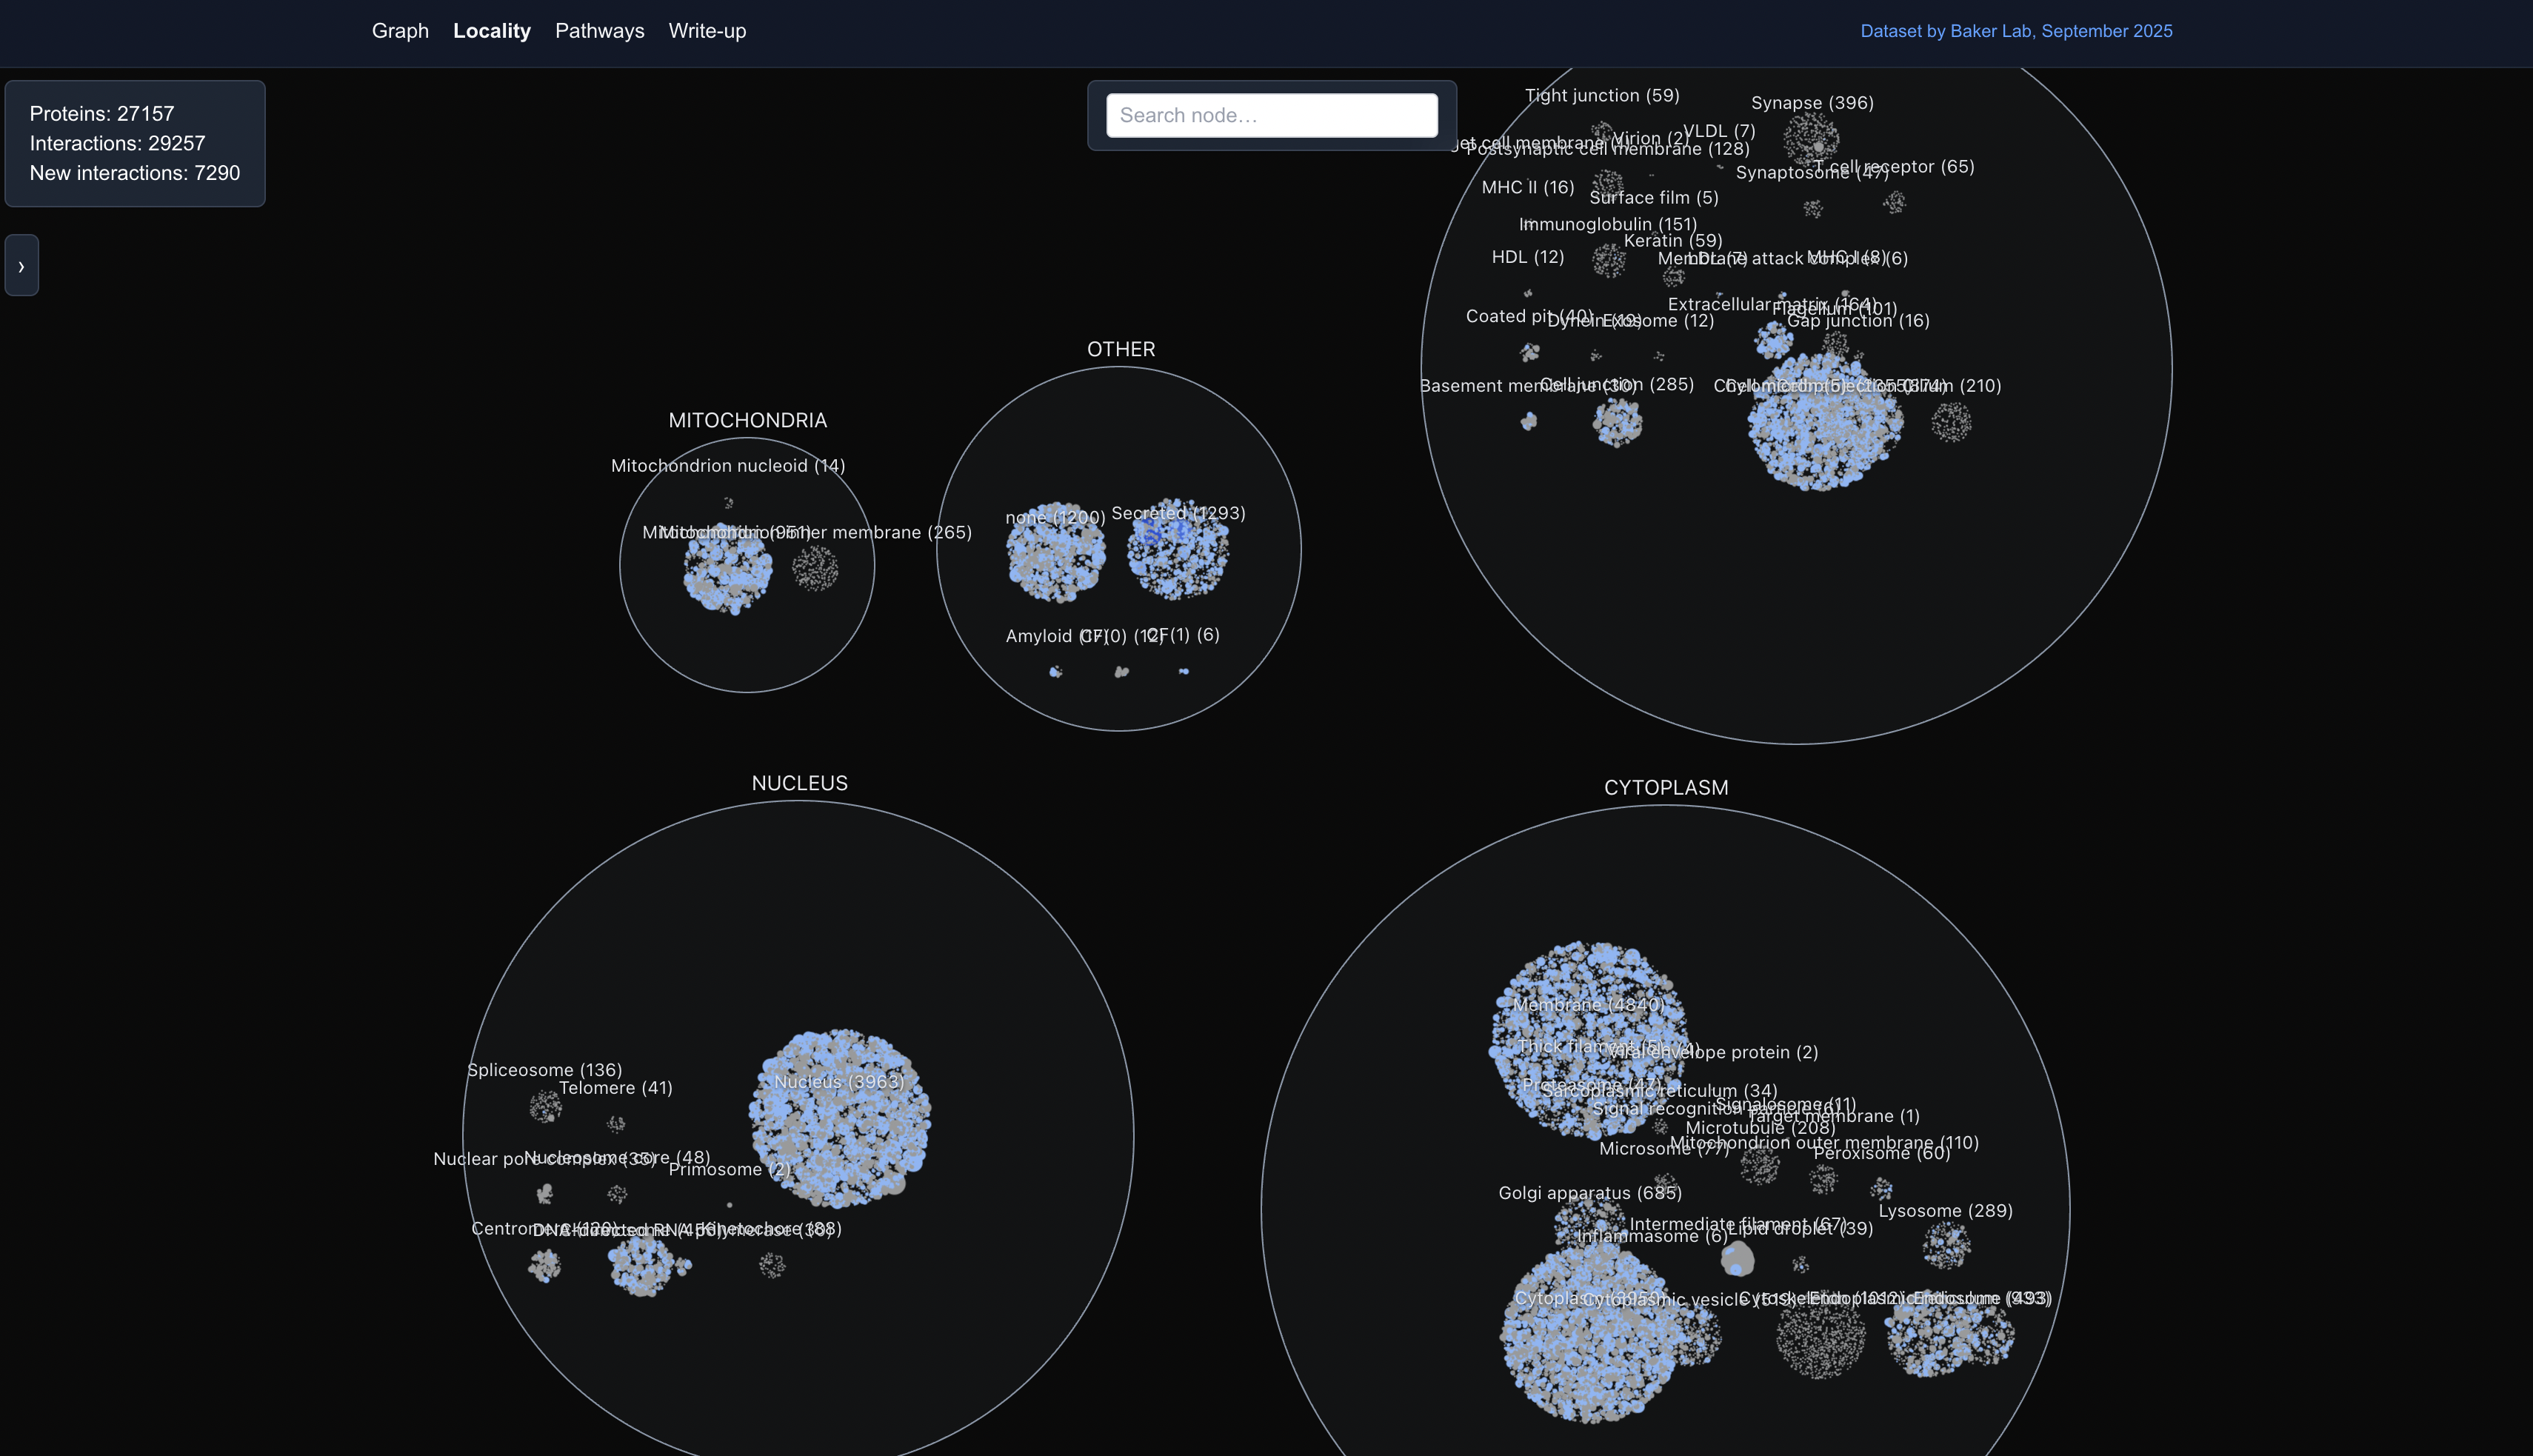
The tool offered an easy way to visually investigate alleged new PPIs predicted by the pipeline (interactions that don’t exist in known experimental databases). More contexts were further provided by the Locality View, which clustered proteins by their subcellular location:
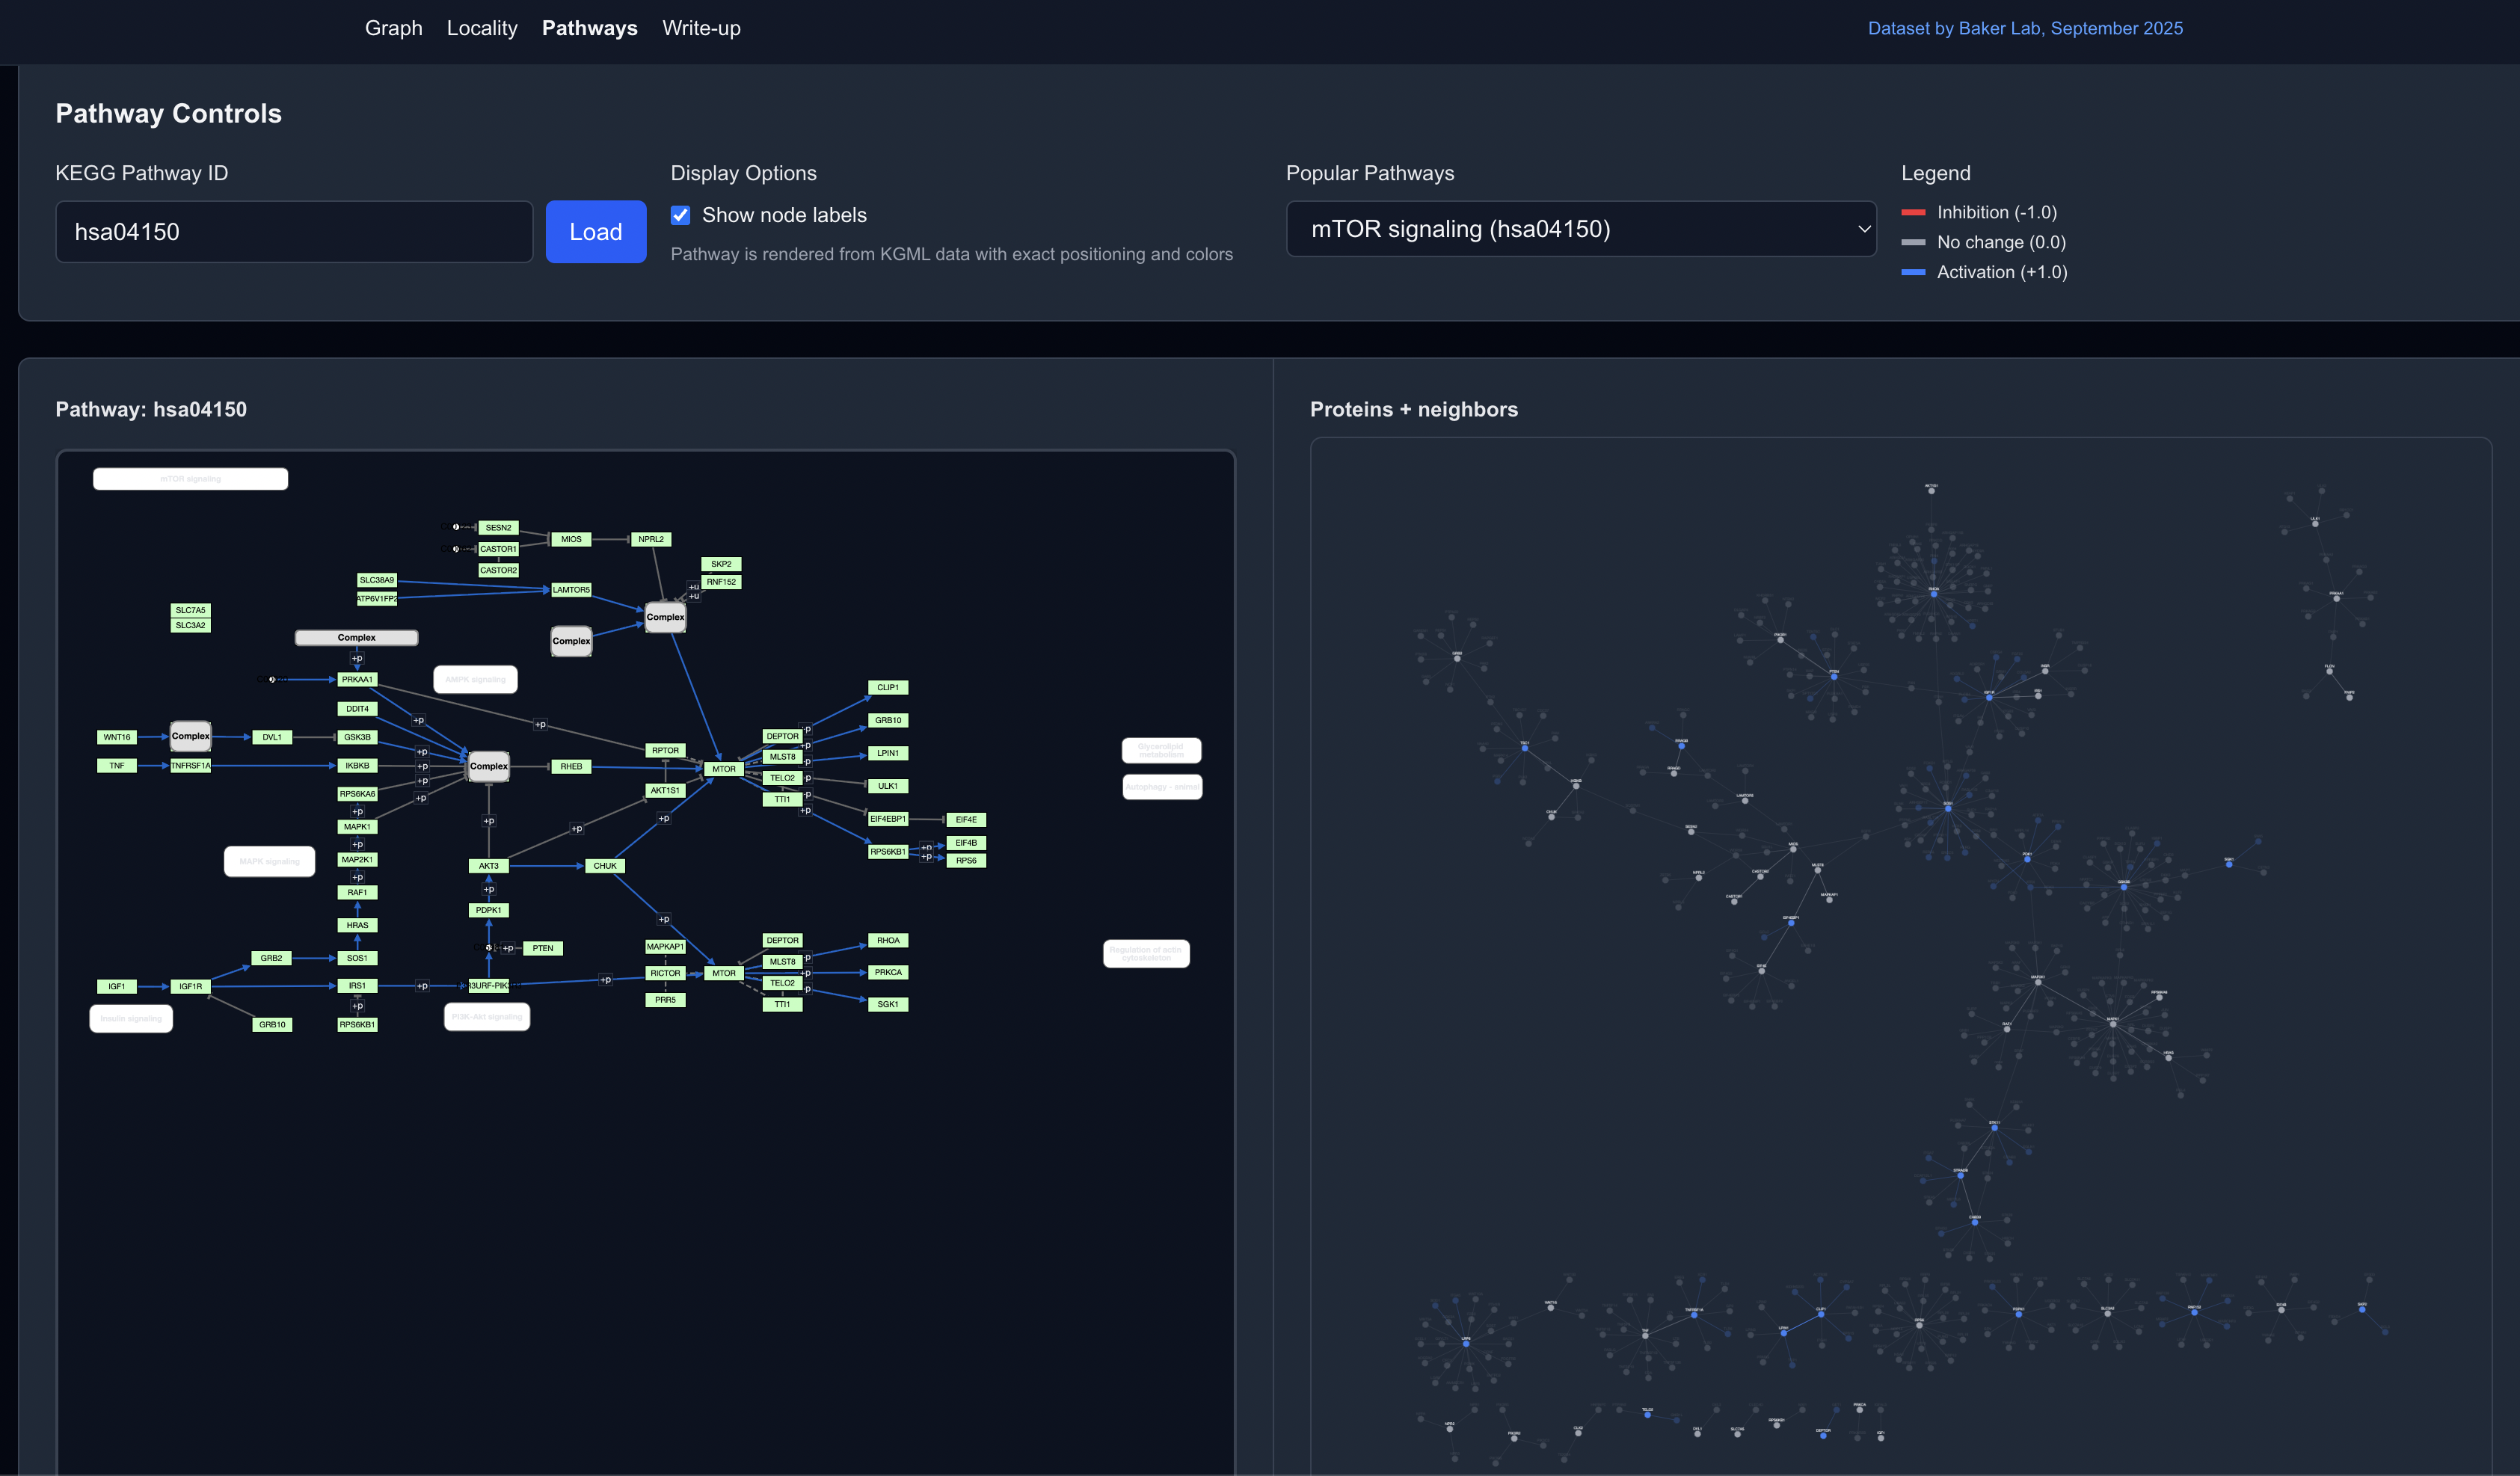
Or the Pathways view, which overlay the protein graph on defined pathways to put the pathway in the larger cellular context:
Read the full writeup for an in-depth discussion of the tools and biological insights from this predicted dataset.